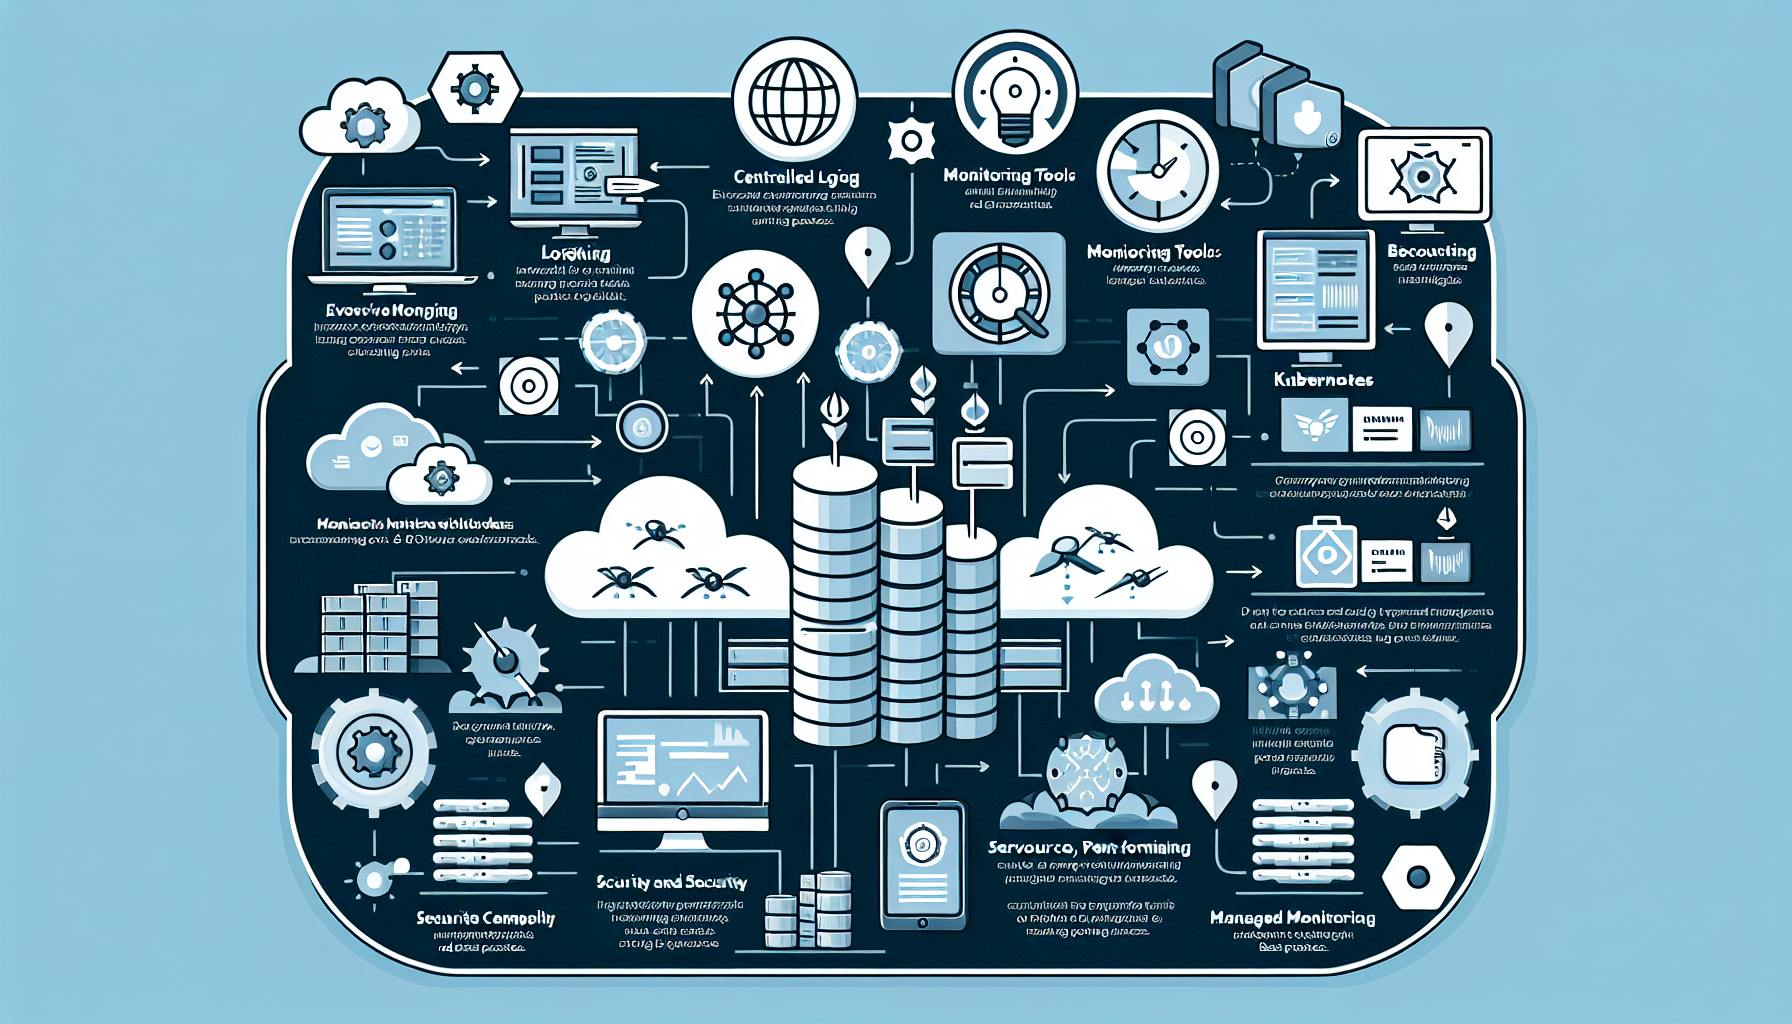
Monitoring and logging Kubernetes workloads effectively is crucial for ensuring the availability, performance, and security of your applications. Here’s a comprehensive guide to help you achieve this:
1. Set Up a Centralized Logging Solution
Kubernetes workloads generate logs from applications, containers, and the Kubernetes control plane. Centralizing these logs is critical for efficient management and troubleshooting.
- Tools:
- ELK Stack (Elasticsearch, Logstash, Kibana): A robust solution for log aggregation, indexing, and visualization.
- Fluentd/Fluent Bit: Lightweight log forwarders that can collect logs from Kubernetes nodes and send them to a centralized log store.
- Loki (by Grafana): A log aggregation tool optimized for Kubernetes, integrates easily with Grafana for visualization.
-
Cloud Logging: If you’re on a cloud platform (e.g., GCP, AWS, Azure), use their native logging solutions (e.g., Google Cloud Logging, AWS CloudWatch).
-
Setup Steps:
- Deploy a logging agent (e.g., Fluentd or Fluent Bit) as a DaemonSet on your cluster to collect logs from all nodes.
- Configure the logging agent to ship logs to your chosen backend (e.g., Elasticsearch, Loki, or a cloud logging service).
- Use labels and filters to organize logs by namespace, pod, or container for easier analysis.
2. Implement Robust Monitoring
Monitoring gives you insight into the health, performance, and resource consumption of your Kubernetes workloads.
- Tools:
- Prometheus and Grafana: Prometheus is the de facto standard for monitoring Kubernetes clusters. Combine it with Grafana for powerful visualization.
- Kubernetes Metrics Server: Provides resource usage metrics like CPU and memory consumption.
-
Datadog, New Relic, or Dynatrace: Commercial, full-stack observability platforms with Kubernetes integrations.
-
Setup Steps:
- Deploy Prometheus using Helm or the Prometheus Operator.
- Configure Prometheus to scrape metrics from Kubernetes components (e.g., kube-apiserver, kube-scheduler) and workloads.
- Visualize metrics in Grafana using pre-built dashboards or custom queries.
- Set up alerts in Prometheus or Grafana to notify you of issues (e.g., high CPU usage, pod restarts).
3. Enable Kubernetes Native Tools
Kubernetes provides built-in tools for basic monitoring and logging.
- kubectl logs: View logs from individual pods.
bash

kubectl logs <pod-name> - kubectl top: View resource usage of nodes and pods.
bash

  kubectl top pod

kubectl top node - Kubernetes Events: Use
kubectl get eventsto see important cluster events (e.g., pod failures, scaling events).
While these tools are useful for quick checks, they are not sufficient for long-term monitoring or centralized logging.
4. Use Application Performance Monitoring (APM)
If you run complex, distributed applications, you may need deeper visibility into application performance.
- Tools:
- Jaeger: For distributed tracing in microservices-based architectures.
- OpenTelemetry: Collects traces, logs, and metrics for modern applications.
-
Istio or Linkerd: Service meshes that can provide observability for service-to-service communication.
-
Setup Steps:
- Instrument your applications with tracing libraries (e.g., OpenTelemetry SDK).
- Deploy a tracing backend like Jaeger or Zipkin.
- Visualize traces to analyze latency, bottlenecks, and dependencies.
5. Monitor Security and Policy Compliance
Security monitoring is essential to detect and respond to threats in your Kubernetes environment.
- Tools:
- Falco: A runtime security tool that detects abnormal behaviors in Kubernetes workloads.
- Kube-bench: Checks your cluster against Kubernetes security best practices (CIS benchmarks).
-
Aqua Trivy: Scans container images for vulnerabilities.
-
Setup Steps:
- Deploy Falco as a DaemonSet to monitor runtime behavior.
- Run Kube-bench regularly to ensure compliance with security benchmarks.
- Scan all container images with Trivy before deployment.
6. Optimize Observability with Labels and Annotations
Labels and annotations in Kubernetes are critical for organizing and querying logs, metrics, and events.
- Add meaningful labels to your workloads (e.g.,
app=frontend,env=prod). - Use annotations for metadata like the application version or contact information.
7. Automate Alerts and Notifications
Set up alerts to be notified proactively about issues in your workloads.
- Prometheus Alertmanager: Define rules to trigger alerts based on metrics thresholds.
- Third-Party Integrations: Send alerts to communication tools like Slack, Microsoft Teams, or PagerDuty.
8. Monitor Kubernetes Control Plane
Don’t overlook the health of the Kubernetes control plane itself.
- Metrics to Monitor:
- API server latency and request rates.
- Scheduler performance.
- ETCD health and disk usage.
- Use Prometheus or cloud-native tools to monitor these components.
9. Monitor Cluster Resource Utilization
Keep an eye on cluster-wide resource usage to prevent over-provisioning or resource starvation.
- Tools:
- Kube-state-metrics: Exposes Kubernetes resource states as Prometheus metrics.
- Vertical Pod Autoscaler (VPA): Automatically adjusts resource requests for pods.
- Cluster Autoscaler: Adds or removes nodes based on workload demands.
10. Consider Managed Monitoring Solutions
If you don’t have the resources to manage monitoring and logging in-house, consider managed services like:
– Google Cloud Operations Suite
– AWS CloudWatch Container Insights
– Azure Monitor for Containers
Best Practices
- Retention Policies: Define log and metric retention periods to balance cost and compliance.
- Dashboards: Create dashboards for key workloads, namespaces, and cluster components.
- Testing: Regularly test your monitoring and alerting setup to ensure it works in real incidents.
- RBAC: Secure your monitoring and logging tools with proper Role-Based Access Control (RBAC).
By implementing these strategies and tools, you’ll have a robust monitoring and logging setup for your Kubernetes workloads, ensuring better performance, reliability, and security.


