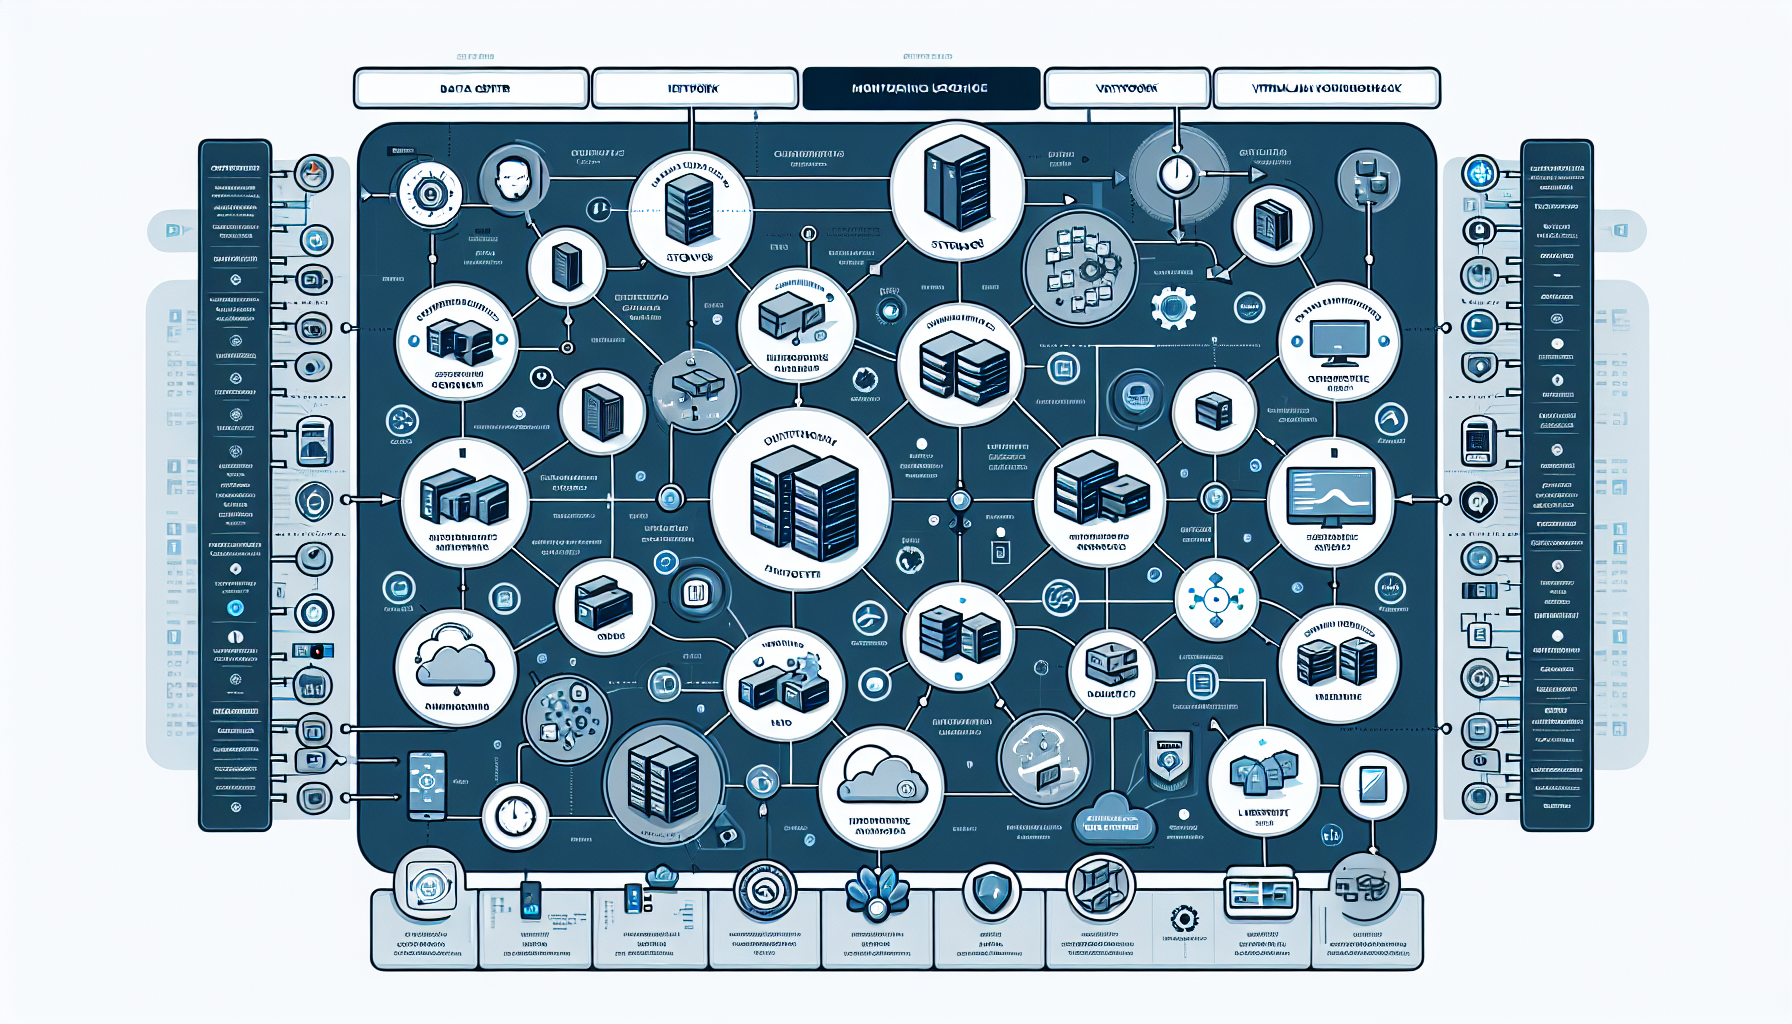
Implementing IT infrastructure monitoring and logging is essential for ensuring the health, performance, and security of your systems. Here’s a comprehensive guide to help you set up effective monitoring and logging for your IT infrastructure:
1. Define Your Objectives
Before implementing monitoring and logging, clearly define what you want to achieve:
– Proactive Issue Detection: Identify issues before they affect users.
– Performance Optimization: Monitor resource usage to optimize performance.
– Capacity Planning: Track trends to plan for future scaling needs.
– Security Monitoring: Detect suspicious activities.
– Compliance: Meet regulatory requirements with logging and auditing.
2. Identify Key Areas to Monitor
Focus on the critical components of your infrastructure:
– Datacenter: Monitor cooling systems, power usage, rack temperature, and network connectivity.
– Servers: Track CPU, RAM, disk I/O, network bandwidth, and uptime.
– Storage: Monitor disk utilization, performance metrics (IOPS), and latency.
– Backup: Ensure backups are running as scheduled and validate the integrity of backups.
– Virtualization: Monitor hypervisors (e.g., VMware, Hyper-V), VM resource allocation, and host health.
– Operating Systems: Use tools to monitor Windows and Linux health, resource usage, and logs.
– Kubernetes: Monitor pod health, node status, cluster performance, and resource utilization.
– AI Workloads: Track GPU utilization, memory usage, and inference latency.
– Network: Monitor bandwidth, latency, packet loss, and firewall logs.
– Security: Track login attempts, privilege escalations, and unusual network activity.
3. Choose Monitoring Tools
Select tools based on the complexity and scale of your infrastructure:
– Datacenter Monitoring: Tools like Schneider Electric EcoStruxure or Datacenter Infrastructure Management (DCIM) solutions.
– Server and Virtualization Monitoring: Nagios, Zabbix, SolarWinds, PRTG, or Veeam ONE.
– Storage Monitoring: Vendor-specific tools (e.g., Dell EMC Unisphere, NetApp Active IQ).
– Backup Monitoring: Tools like Veeam Backup & Replication, Commvault, or Rubrik.
– Linux and Windows: Use Prometheus, Grafana, Telegraf, and Windows Performance Monitor.
– Kubernetes Monitoring: Tools like Prometheus, Grafana, Datadog, or Kubernetes Dashboard.
– AI and GPU Monitoring: NVIDIA DCGM (Data Center GPU Manager), Prometheus with custom metrics.
– Network Monitoring: Wireshark, SolarWinds Network Performance Monitor, or PRTG.
– Security Logging: SIEM solutions like Splunk, QRadar, Elastic Security, or Graylog.
4. Implement Logging
Logging is complementary to monitoring and provides deeper insights into system events:
– Centralized Logging: Implement a log aggregation system like ELK Stack (Elasticsearch, Logstash, Kibana), Splunk, or Fluentd.
– Log Retention: Define policies for log retention based on compliance needs.
– Log Rotation: Set up log rotation to avoid disk space issues.
– Log Analysis: Use tools to parse and analyze logs to identify patterns and anomalies.
5. Configure Alerts
- Set up threshold-based alerts for key metrics (e.g., CPU > 80%, Disk > 90%).
- Use event-driven alerts for critical log entries (e.g., failed login attempts, hardware failure).
- Integrate alerts with communication platforms like Slack, Microsoft Teams, PagerDuty, or email.
6. Automate Monitoring
Where possible, automate monitoring and responses:
– Use Infrastructure-as-Code (IaC) tools like Terraform or Ansible to deploy monitoring agents automatically.
– Implement scripts to auto-remediate common issues (e.g., restarting a service if it crashes).
7. Set Up Dashboards
Create dashboards for real-time visibility into your infrastructure:
– Use tools like Grafana or Kibana to visualize metrics and logs.
– Build dashboards tailored to different teams (e.g., DevOps, Security, Network Ops).
8. Regular Reporting
Generate periodic reports to review:
– Infrastructure performance trends.
– Security events.
– Backup success rates.
– Capacity utilization.
Use these reports to plan for upgrades, scaling, or addressing vulnerabilities.
9. Conduct Regular Audits
Periodically audit your monitoring and logging setup:
– Ensure all critical systems are being monitored.
– Validate the accuracy of alerts and logs.
– Review and improve configurations based on new challenges or technologies.
10. Consider Cloud Monitoring
If you’re using cloud services (e.g., AWS, Azure, Google Cloud), leverage their built-in monitoring and logging tools:
– AWS CloudWatch
– Azure Monitor and Log Analytics
– Google Cloud Operations Suite (formerly Stackdriver)
11. Train Staff
Ensure your IT team is trained to:
– Use monitoring and logging tools effectively.
– Respond to alerts and investigate logs.
– Develop automated solutions for common issues.
12. Security and Compliance
- Encrypt logs to protect sensitive information.
- Restrict access to monitoring and logging tools to authorized personnel.
- Ensure compliance with standards like GDPR, HIPAA, or ISO 27001.
By following these steps, you can build a robust monitoring and logging system that provides visibility into your IT infrastructure and helps you proactively address issues.


