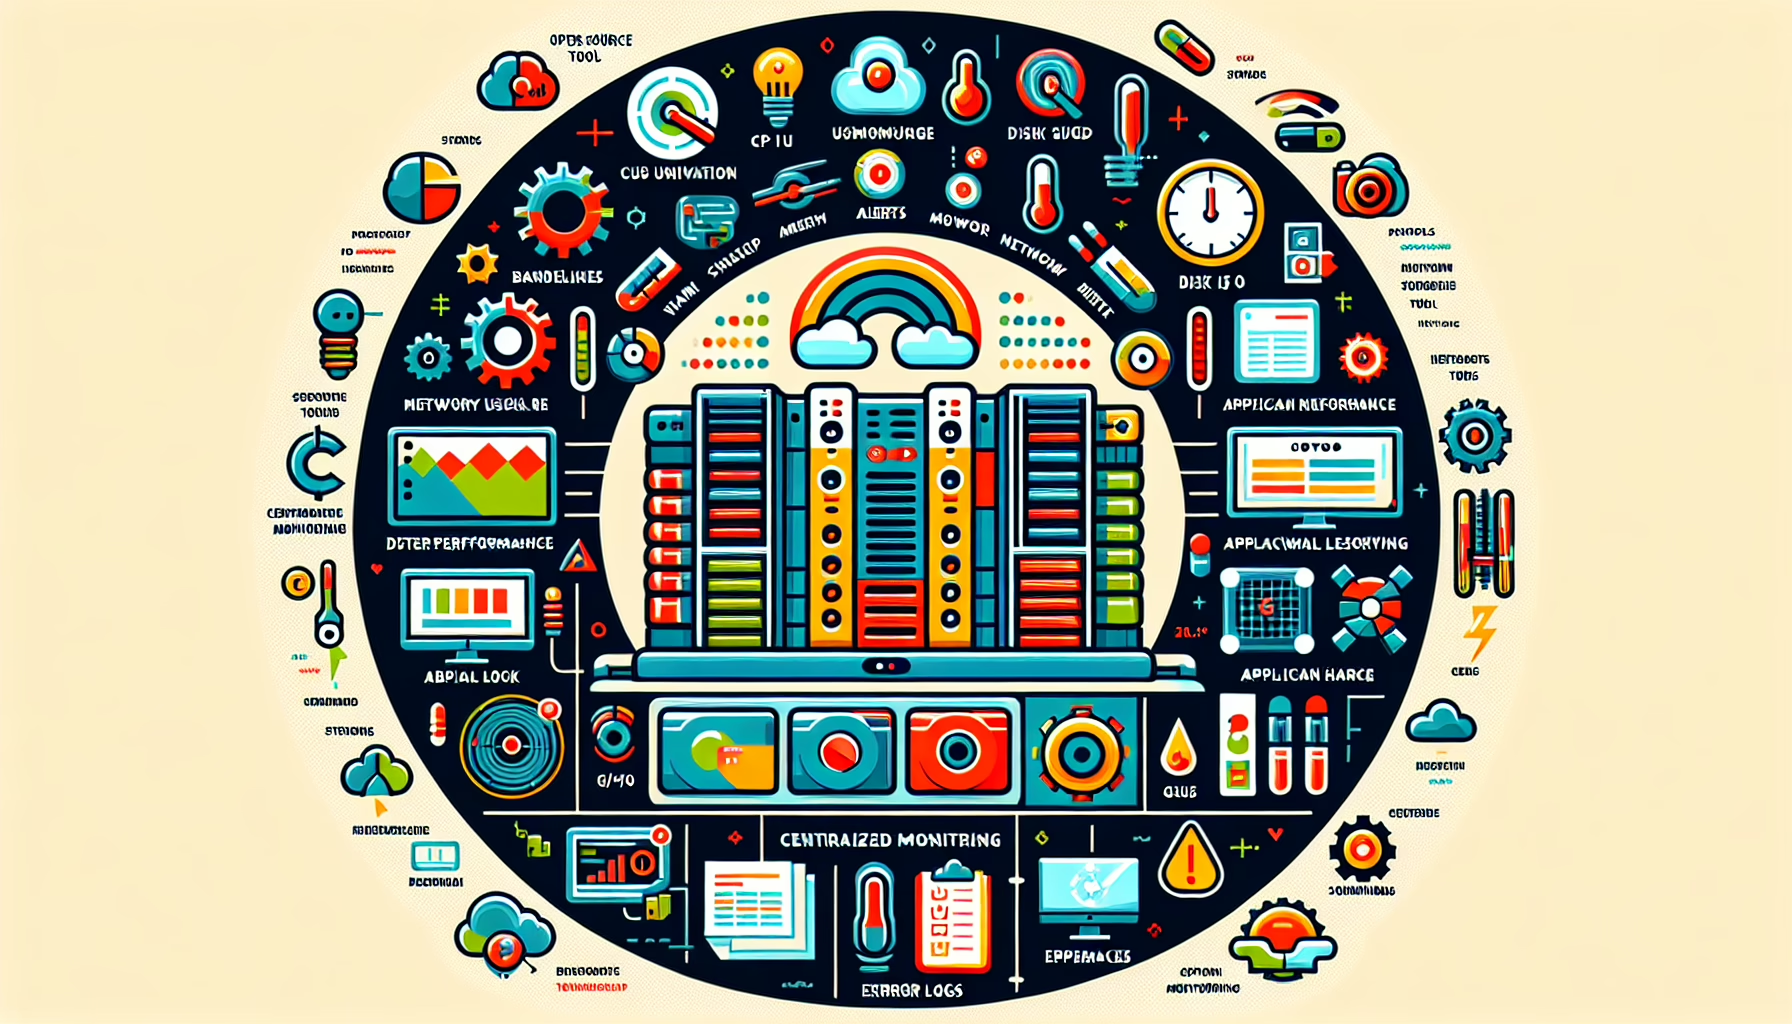
Monitoring server performance and resource utilization is critical for ensuring optimal performance, preventing downtime, and proactively addressing issues. As an IT manager responsible for managing datacenters, storage, servers, virtualization, and related infrastructure, here are the best practices and tools for monitoring server performance:
Key Metrics to Monitor
- CPU Utilization
- Monitor processor usage to ensure workloads aren’t overloading the server.
-
Watch for sustained high usage, which can indicate bottlenecks.
-
Memory Usage
- Track RAM utilization to ensure applications have sufficient memory.
-
Look for memory leaks or systems running out of available memory.
-
Disk I/O
- Monitor read/write operations to identify storage bottlenecks.
-
Watch for high disk queue lengths or latency.
-
Network Utilization
- Measure bandwidth usage and latency.
-
Look for packet drops, high retransmissions, or saturation.
-
Application Performance
- Monitor specific applications or services running on the server.
-
Ensure they are functioning optimally without delays or errors.
-
Temperature and Power Usage
-
Track hardware temperature and power consumption to prevent overheating or inefficiencies.
-
GPU Utilization (if applicable)
-
For servers with GPU cards (used for AI workloads, graphics rendering, etc.), monitor GPU usage, memory, and temperature.
-
Error Logs
- Monitor system logs for hardware failures, disk errors, or other issues.
Tools for Monitoring Server Performance
Here are some tools you can use for monitoring server performance and resource utilization:
Open Source Tools
- Prometheus + Grafana
- Prometheus collects metrics from servers and applications, while Grafana visualizes them in dashboards.
-
Ideal for Kubernetes, containers, and modern infrastructure.
-
Nagios
- Provides comprehensive monitoring for servers, applications, and network devices.
-
Alerts for performance issues or failures.
-
Zabbix
- Offers advanced monitoring for servers, VMs, applications, and services.
-
Good for large-scale environments.
-
Icinga
-
A fork of Nagios with advanced monitoring and visualization capabilities.
-
Netdata
- Lightweight, real-time monitoring tool for system performance metrics.
Commercial Tools
- SolarWinds Server & Application Monitor
- Provides in-depth monitoring for servers, applications, and services.
-
Includes alerting and reporting capabilities.
-
Datadog
- A cloud-based monitoring platform for servers, applications, and infrastructure.
-
Excellent for hybrid and multi-cloud environments.
-
Dynatrace
-
AI-driven monitoring with focus on application performance, server health, and cloud resources.
-
VMware vRealize Operations
-
Ideal for monitoring VMware-based environments and virtualized workloads.
-
Microsoft System Center Operations Manager (SCOM)
- Provides monitoring for Windows environments, including servers, VMs, and applications.
Linux-Specific Tools
- htop
-
A terminal-based tool for monitoring system processes, CPU, memory, and swap usage.
-
iostat
-
Provides statistics on CPU, disk I/O, and device utilization.
-
vmstat
-
Reports on system performance, including memory, CPU, and disk activity.
-
nmon
- Consolidated monitoring tool for Linux performance metrics.
Windows-Specific Tools
- Task Manager
- Provides real-time CPU, memory, and disk usage information.
-
Useful for quick checks.
-
Performance Monitor (PerfMon)
-
Built-in Windows tool for monitoring detailed performance counters.
-
Resource Monitor
- Offers a real-time view of hardware and software resource utilization.
Best Practices for Monitoring
- Set Baselines
-
Establish baseline performance metrics to compare against unusual spikes or dips.
-
Define Alerts
-
Configure thresholds to trigger alerts for critical metrics (e.g., CPU > 90%, Disk I/O latency > 20ms).
-
Automate Monitoring
-
Use tools with automation capabilities to reduce manual intervention.
-
Centralize Monitoring
-
Integrate monitoring data into a single dashboard for better visibility.
-
Monitor Trends
-
Track historical data to identify patterns or trends, such as growing resource utilization over time.
-
Focus on Key Applications
-
Prioritize monitoring for mission-critical applications and workloads.
-
Regular Audits
- Perform regular audits to ensure monitoring tools and configurations are up-to-date.
Special Considerations for Kubernetes & AI Workloads
- Kubernetes Monitoring
- Use tools like Prometheus and Grafana, or Kubernetes-native tools like Kube-state-metrics.
-
Monitor pod resource usage, cluster health, and container performance.
-
AI Workloads
- Monitor GPU utilization (e.g., using NVIDIA’s
nvidia-smitool). - Ensure adequate cooling for GPU-intensive servers.
By implementing effective monitoring practices and leveraging the right tools, you can proactively manage server performance, optimize resource usage, and minimize downtime.


