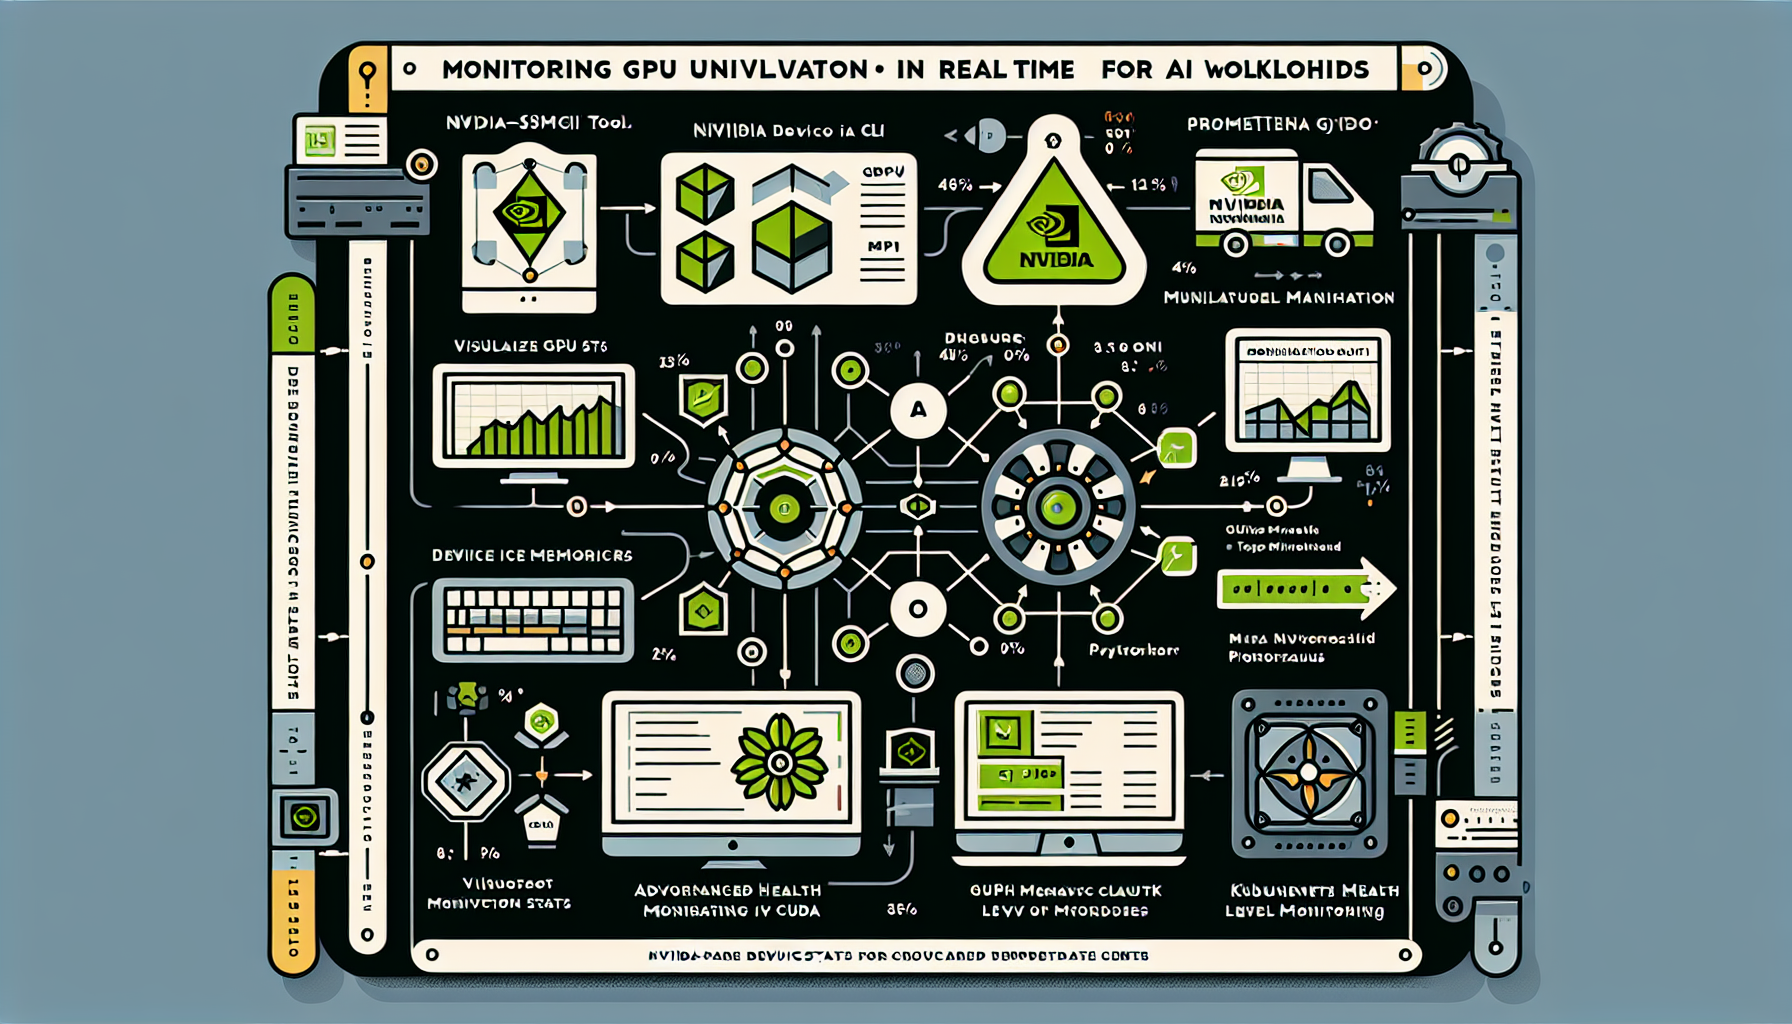
Monitoring GPU utilization in real time for AI workloads is critical to ensure that your hardware resources are being effectively utilized and to identify potential bottlenecks. Here are some effective ways to monitor GPU utilization across various platforms and tools:
1. Use NVIDIA-Specific Tools
If you’re using NVIDIA GPUs, NVIDIA provides several tools for monitoring GPU utilization:
a. nvidia-smi (NVIDIA System Management Interface)
- This is a command-line tool that comes with NVIDIA drivers.
- Run the following command to monitor GPU usage in real time:
nvidia-smi -l 1
The-l 1flag refreshes the output every second. - It displays metrics such as GPU utilization, memory utilization, temperature, power usage, and running processes.
b. NVIDIA DCGM (Data Center GPU Manager)
- DCGM is a suite of tools for managing and monitoring NVIDIA GPUs in data center environments.
- It provides advanced metrics and health monitoring for workloads running on GPUs.
- You can integrate DCGM with your monitoring stack for automated alerting and reporting.
2. Use Monitoring Dashboards
a. Prometheus and Grafana
- Prometheus can scrape metrics from NVIDIA GPUs using the DCGM Exporter or the NVIDIA GPU Exporter.
- Grafana can visualize these metrics in real time with customizable dashboards.
- Metrics to monitor:
- GPU utilization percentage
- Memory usage and percentage
- GPU temperature
- Power consumption
b. Kubernetes Monitoring with GPU Workloads
- If you’re running AI workloads in Kubernetes, you can deploy the NVIDIA GPU Operator to manage and monitor GPUs.
- Use tools like Prometheus and Grafana to collect and visualize GPU metrics from your Kubernetes cluster.
- Alternatively, tools like Kubectl or Lens (Kubernetes IDE) can also show GPU allocation per pod.
3. AI Framework-Specific Monitoring
If you’re using deep learning frameworks like TensorFlow, PyTorch, or JAX, you can monitor GPU utilization programmatically:
a. TensorFlow
python

from tensorflow.python.client import device_lib

print(device_lib.list_local_devices())
b. PyTorch
python

import torch

print(torch.cuda.is_available())

print(torch.cuda.device_count())

print(torch.cuda.get_device_name(0))

print(torch.cuda.memory_allocated(0))

print(torch.cuda.memory_reserved(0))
These methods provide memory usage and GPU availability directly from your AI framework.
4. Third-Party GPU Monitoring Tools
If you want a more comprehensive or user-friendly monitoring tool, consider the following:
a. GPUtil
- A Python library for monitoring GPUs.
“`python
import GPUtil
from tabulate import tabulate
gpus = GPUtil.getGPUs()
list_gpus = [(gpu.id, gpu.name, f”{gpu.load*100}%”, f”{gpu.memoryUsed}MB”, f”{gpu.memoryTotal}MB”) for gpu in gpus]
print(tabulate(list_gpus, headers=(“ID”, “Name”, “Load”, “Used Memory”, “Total Memory”)))
“`
b. nvtop (NVIDIA Top)
- A real-time GPU usage monitoring tool similar to
htopbut for GPUs. - Install it and run
nvtopto see GPU usage in real time.
5. Cloud-Specific Monitoring
If you’re running GPUs in the cloud, most providers offer built-in monitoring tools:
a. AWS CloudWatch
- Use CloudWatch metrics to monitor GPU utilization for EC2 instances with GPUs.
- Enable the NVIDIA GPU CloudWatch Agent for detailed metrics.
b. Azure Monitor
- Azure provides GPU metrics for its N-series VM instances.
- Enable Azure Monitor to collect and visualize metrics.
c. Google Cloud Monitoring
- Use Google Cloud’s monitoring tools to track GPU utilization for GCP instances.
- Metrics such as GPU duty cycle and memory utilization are available.
6. Automate Alerts and Thresholds
Set up automated alerts for GPU utilization metrics to prevent resource underutilization or overutilization:
– Use tools like Prometheus Alertmanager, CloudWatch Alarms, or Azure Monitor Alerts.
– Configure alerts for:
– High GPU utilization (e.g., above 90%)
– Low GPU utilization (e.g., below 10%)
– High memory usage (e.g., above 80%)
Best Practices for Monitoring GPU Utilization
- Enable Persistence Mode: Use
nvidia-smi -pm 1to keep GPUs initialized for consistent monitoring. - Monitor AI Workload-Specific Metrics: Track GPU memory allocation, data throughput, and AI model performance metrics alongside GPU utilization.
- Optimize Workloads: If you notice low GPU utilization, optimize your AI workloads to make better use of the hardware (e.g., batch sizes, mixed precision training).
- Correlate with Other Metrics: Combine GPU monitoring with CPU, network, and disk metrics to identify potential bottlenecks.
By combining the tools and methods above, you can effectively monitor GPU utilization in real time and ensure your AI workloads are running efficiently.

Ali YAZICI is a Senior IT Infrastructure Manager with 15+ years of enterprise experience. While a recognized expert in datacenter architecture, multi-cloud environments, storage, and advanced data protection and Commvault automation , his current focus is on next-generation datacenter technologies, including NVIDIA GPU architecture, high-performance server virtualization, and implementing AI-driven tools. He shares his practical, hands-on experience and combination of his personal field notes and “Expert-Driven AI.” he use AI tools as an assistant to structure drafts, which he then heavily edit, fact-check, and infuse with my own practical experience, original screenshots , and “in-the-trenches” insights that only a human expert can provide.
If you found this content valuable, [support this ad-free work with a coffee]. Connect with him on [LinkedIn].


