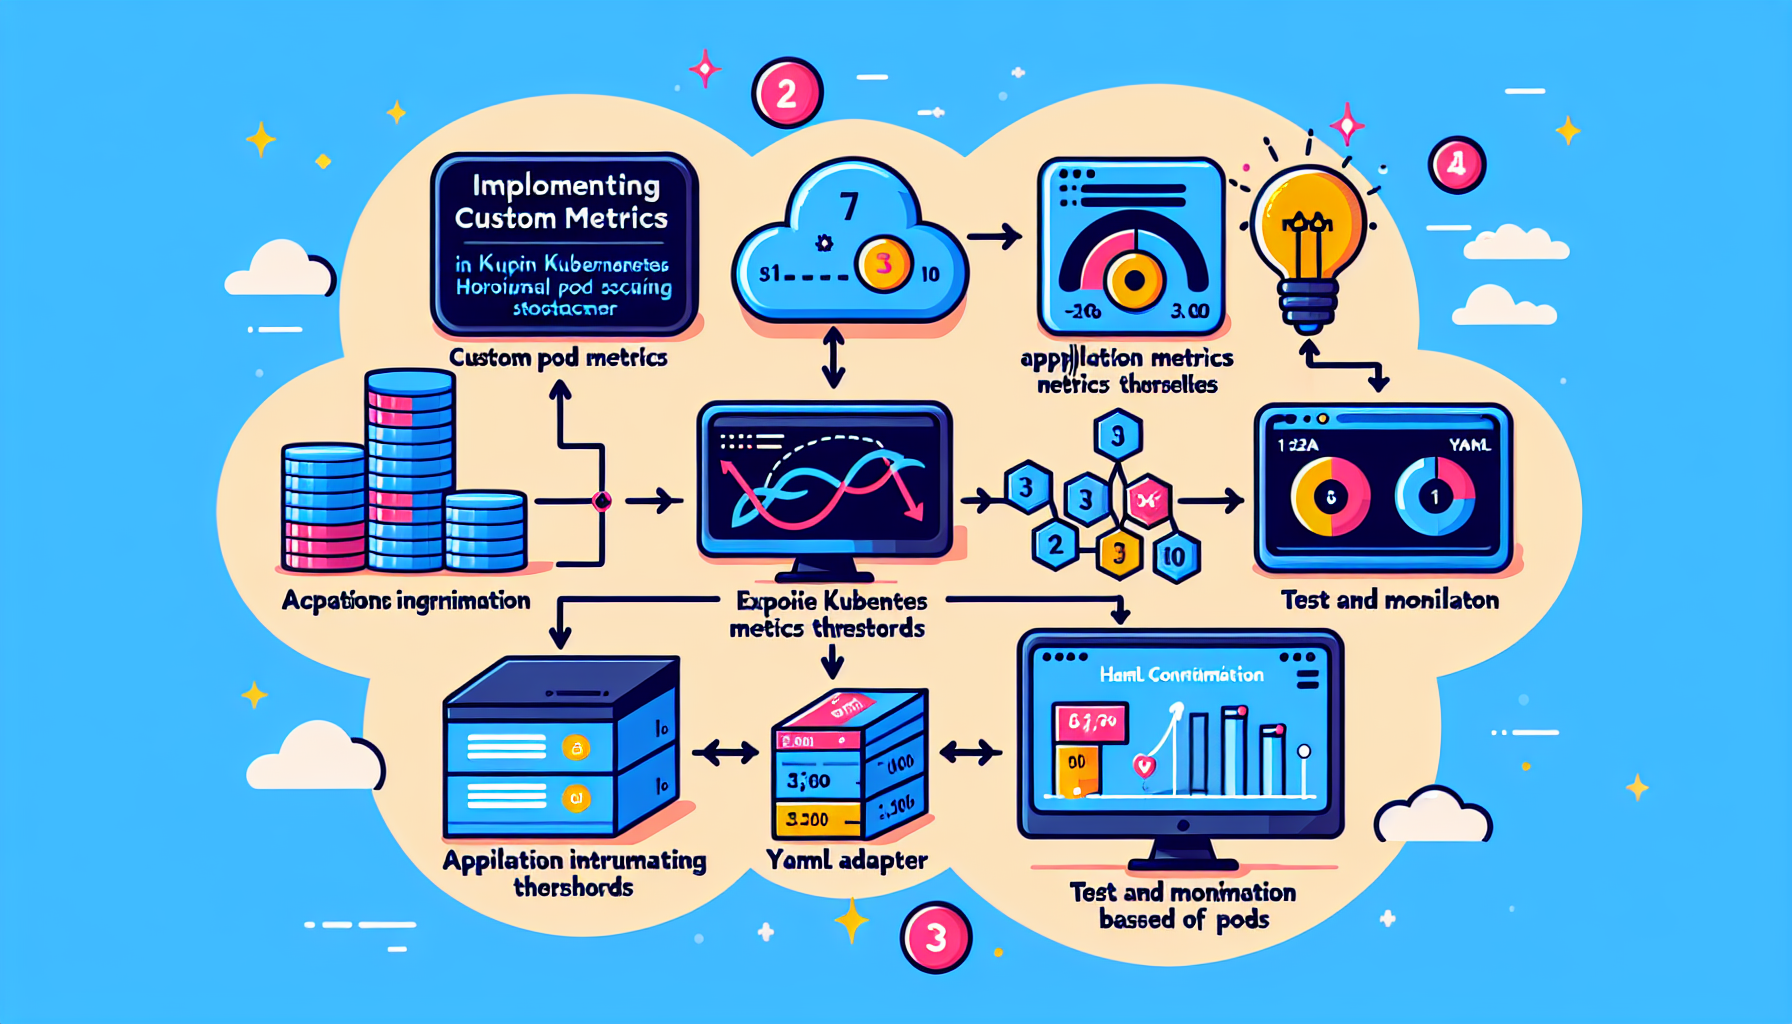
Implementing custom metrics in Kubernetes Horizontal Pod Autoscaler (HPA) allows you to scale your application based on metrics that are specific to your use case rather than default metrics like CPU or memory usage. Here’s a step-by-step guide to implementing custom metrics for HPA:
1. Understand HPA and Custom Metrics
HPA relies on the Kubernetes Metrics API to retrieve metrics. For custom metrics, you need a component that provides these metrics to the Kubernetes Metrics API. This is typically achieved using the Custom Metrics API.
2. Set Up a Metrics Adapter
To use custom metrics, you need a metrics adapter. Some popular adapters include:
– Prometheus Adapter: Integrates with Prometheus to expose custom metrics to the HPA.
– Stackdriver Adapter: For GCP users, it integrates with Stackdriver Monitoring.
Choose an adapter based on your monitoring stack.
3. Install and Configure the Metrics Adapter
a. Prometheus Adapter Installation
If you’re using Prometheus, install the Prometheus Adapter:
1. Add the Prometheus Adapter Helm chart: bash
helm repo add prometheus-community https://prometheus-community.github.io/helm-charts
helm repo update
2. Install the adapter: bash
helm install prometheus-adapter prometheus-community/prometheus-adapter --namespace kube-system
3. Configure the adapter to expose the required custom metrics. This typically involves editing the values.yaml file to map Prometheus metrics to Kubernetes custom metrics.
b. Verify Adapter Installation
After installation, verify that the custom metrics API is available: bash
kubectl get --raw "/apis/custom.metrics.k8s.io/v1beta1" | jq
This should return a list of custom metrics that the adapter is exposing.
4. Expose Custom Metrics
Ensure your application or monitoring setup exports the custom metrics to your monitoring solution (e.g., Prometheus). For Prometheus, you can expose metrics via:
– Application instrumentation (e.g., using libraries like prometheus-client for Python or prom-client for Node.js).
– Sidecar containers like kube-state-metrics or custom exporters.
5. Create an HPA Configuration for Custom Metrics
Define an HPA manifest to use your custom metric. For example:
In this example:
– Replace your_custom_metric_name with the name of your custom metric exposed by the adapter.
– Set averageValue to the desired threshold for scaling.
6. Test and Monitor Your Setup
Deploy the HPA manifest: bash
kubectl apply -f custom-metric-hpa.yaml
Verify the HPA is using the custom metric: bash
kubectl describe hpa custom-metric-hpa
Test scaling by generating load or adjusting the custom metric.
7. Troubleshooting
If the HPA does not scale as expected:
1. Check if the custom metric is available: bash
kubectl get --raw "/apis/custom.metrics.k8s.io/v1beta1/namespaces/default/pods/*/your_custom_metric_name" | jq
2. Verify the Prometheus query in the adapter configuration.
3. Check the HPA logs and events: bash
kubectl describe hpa custom-metric-hpa
kubectl logs -n kube-system -l app.kubernetes.io/name=prometheus-adapter
8. Best Practices
Use meaningful custom metrics that directly impact application performance.
Monitor the behavior of the HPA to ensure it scales appropriately.
Avoid excessive scaling by setting reasonable thresholds and limits.
By following these steps, you can implement custom metrics for Kubernetes HPA and achieve fine-grained control over your application’s scaling behavior.
How do I implement custom metrics in Kubernetes Horizontal Pod Autoscaler (HPA)?