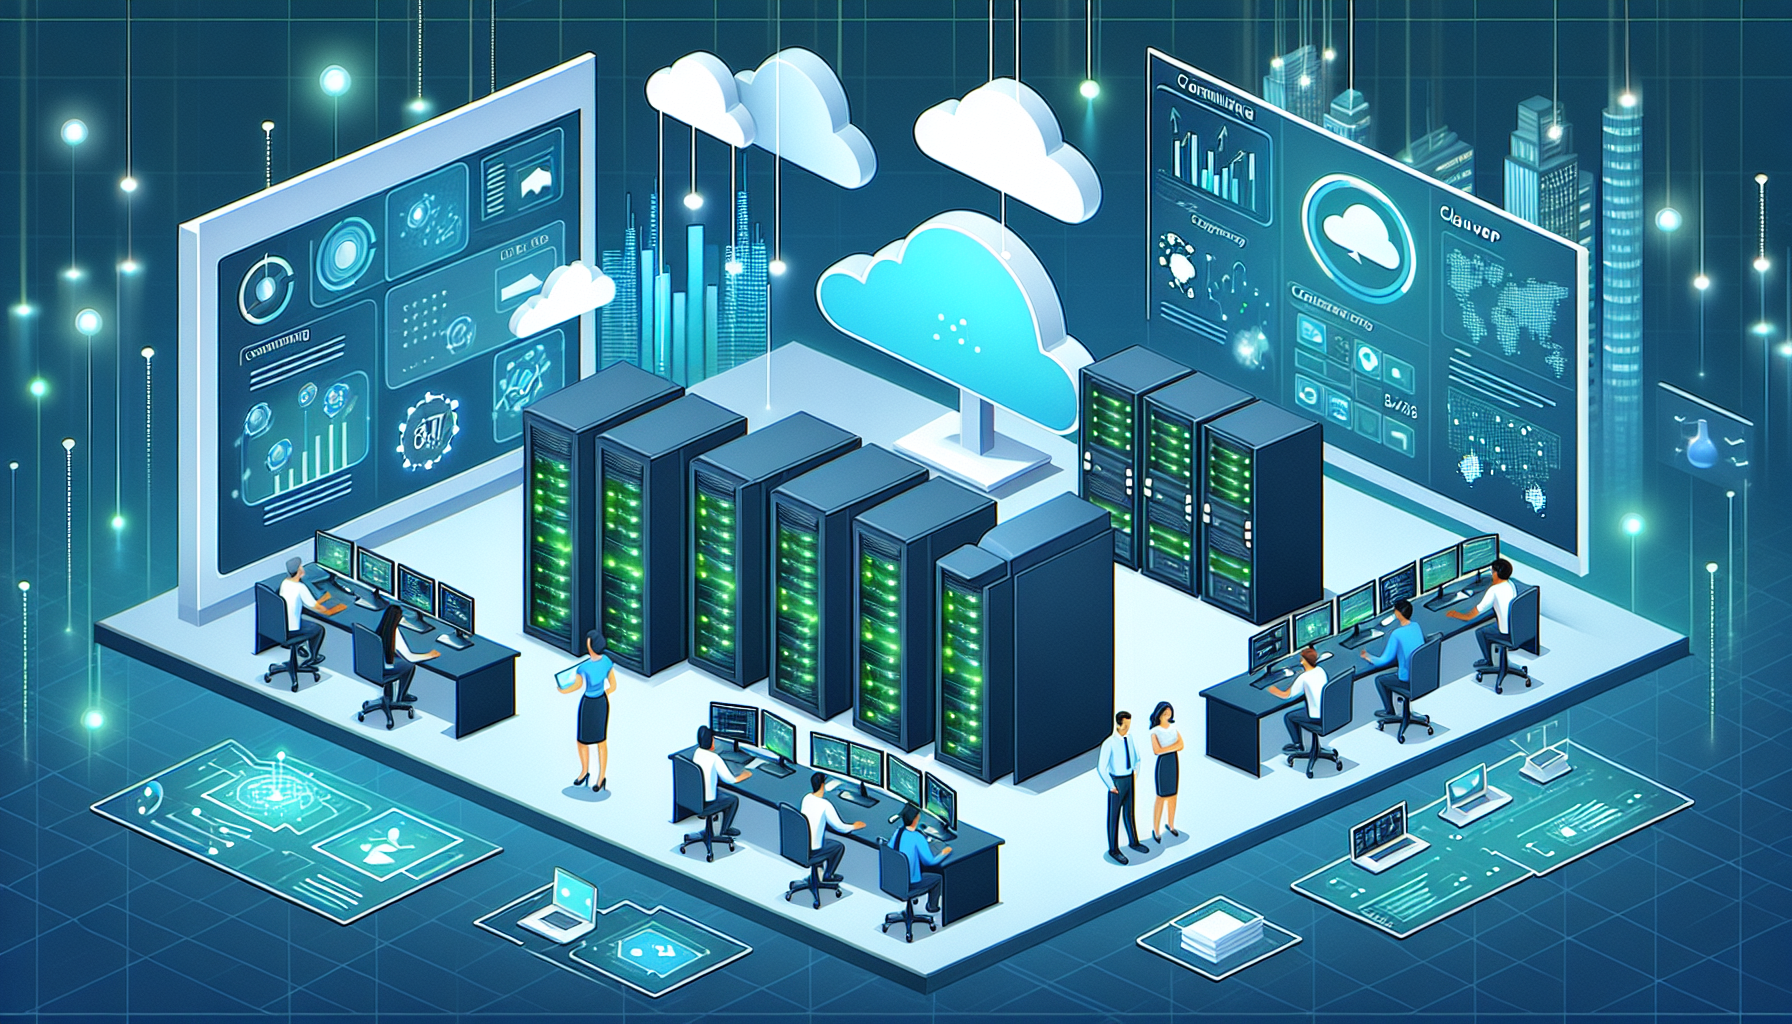
Optimizing IT Infrastructure for 24/7 Uptime: A Step-by-Step Guide from Real-World Experience
Ensuring 24/7 uptime in enterprise IT infrastructure is not just about buying high-end hardware — it’s about designing for resilience, monitoring intelligently, and implementing proactive maintenance strategies. In my experience managing large-scale datacenter and cloud environments, the biggest gains come from anticipating failure points and building redundancy that works under real-world stress.
This guide will walk you through proven steps, pitfalls to avoid, and insider tips for achieving continuous service availability.
1. Architect for Redundancy at Every Layer
A common pitfall I’ve seen is organizations investing in redundant servers but forgetting about single points of failure in network or storage. True 24/7 uptime demands redundancy in compute, storage, networking, and power.
Best Practices:
– Compute Layer: Use clustered virtualization (VMware vSphere HA, Proxmox Cluster, or Kubernetes multi-node setup).
– Storage Layer: Implement storage replication (SAN-to-SAN mirroring, Ceph replication, or NetApp SnapMirror).
– Networking Layer: Use dual uplinks with diverse ISP providers and redundant core switches.
– Power Layer: Dual PDUs per rack, connected to independent UPS systems, and generator backup.
Passive failover can mean downtime during recovery. I’ve had better success with active-active clusters where both nodes serve traffic and can immediately absorb load if one fails.
Example: Kubernetes HA Control Plane yaml
apiVersion: kubeadm.k8s.io/v1beta3
kind: ClusterConfiguration
controlPlaneEndpoint: "vip.example.com:6443"
networking:
podSubnet: "192.168.0.0/16"
etcd:
external:
endpoints:
- https://etcd1.example.com:2379
- https://etcd2.example.com:2379
- https://etcd3.example.com:2379 Pro-tip: Always keep etcd in odd numbers for quorum and test failover quarterly with simulated node shutdowns.
3. Monitor Proactively with Automated Remediation
Monitoring is only half the battle — the real win is automated remediation before users notice a problem.
Tools I’ve successfully deployed:
– Prometheus + Alertmanager for metrics and alerting.
– Grafana for dashboards with SLA compliance views.
– Ansible Tower / AWX to trigger remediation scripts automatically.
Example: Auto-restart service on alert
“`bash
!/bin/bash
SERVICE=$1
if ! systemctl is-active –quiet $SERVICE; then
systemctl restart $SERVICE
logger “Service $SERVICE restarted automatically due to downtime alert”
fi
“`
4. Design for Maintenance Without Downtime
In my experience, planned maintenance can be as disruptive as unexpected outages unless designed for zero-impact.
Strategies:
– Rolling Updates in Kubernetes or VM clusters.
– Live Migration in VMware or KVM.
– Blue-Green Deployments for application changes.
[Visual Aid Placeholder: Rolling Update Timeline Across Nodes]
5. Harden Against Environmental and Human Factors
Your infrastructure is only as strong as its weakest link — sometimes the cause of downtime isn’t technical but operational.
A disaster recovery plan that isn’t tested is just a document. I recommend quarterly DR drills simulating real failure scenarios.
Steps for Effective DR Testing:
1. Define RTO (Recovery Time Objective) and RPO (Recovery Point Objective).
2. Simulate hardware failure and restore from backups.
3. Verify data integrity and application performance post-recovery.
4. Document gaps and improve procedures.
7. Leverage AI for Predictive Maintenance
Recently, I’ve implemented AI-based anomaly detection using historical logs to predict failures before they occur.
Example: GPU-accelerated anomaly detection with PyTorch
“`python
import torch
from sklearn.preprocessing import StandardScaler
threshold = 0.85
anomaly_indices = (scaled > threshold).nonzero(as_tuple=True)
print(“Anomalies detected at:”, anomaly_indices)
“` Pro-tip: Integrate predictive alerts into your monitoring stack so you can act before service impact.
Conclusion
Achieving 24/7 uptime isn’t about eliminating all failures — it’s about designing for resilience, monitoring intelligently, and recovering instantly when something goes wrong. By combining redundancy, proactive monitoring, maintenance strategies, and predictive AI, you can build an IT infrastructure that stays online even under extreme conditions.
In my own deployments, the organizations that adopt these principles not only meet uptime SLAs but also reduce operational stress, improve customer satisfaction, and minimize emergency firefighting. The key is continuous improvement — test, refine, and evolve your infrastructure to stay ahead of downtime risks.
Ali YAZICI is a Senior IT Infrastructure Manager with 15+ years of enterprise experience. While a recognized expert in datacenter architecture, multi-cloud environments, storage, and advanced data protection and Commvault automation , his current focus is on next-generation datacenter technologies, including NVIDIA GPU architecture, high-performance server virtualization, and implementing AI-driven tools. He shares his practical, hands-on experience and combination of his personal field notes and “Expert-Driven AI.” he use AI tools as an assistant to structure drafts, which he then heavily edit, fact-check, and infuse with my own practical experience, original screenshots , and “in-the-trenches” insights that only a human expert can provide.


 infrastructure?")


