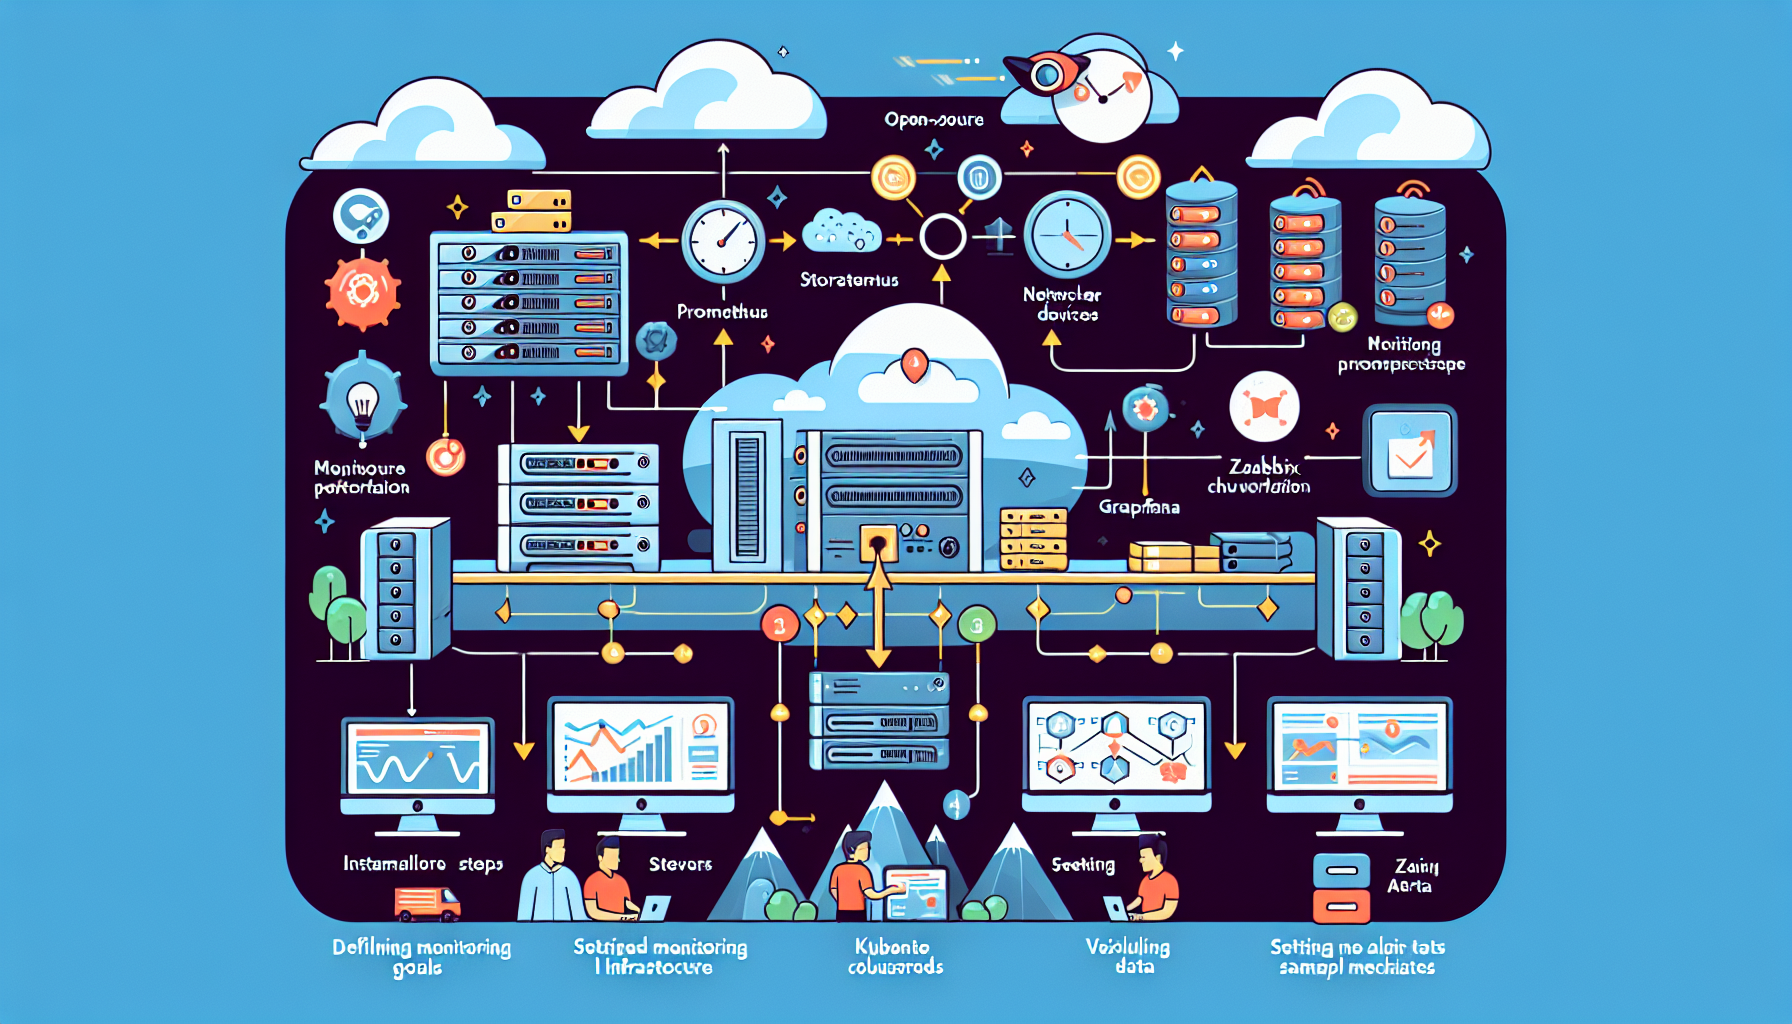
Monitoring IT infrastructure is critical for maintaining performance, ensuring availability, and quickly identifying and resolving issues. Open-source tools provide a cost-effective and highly customizable way to monitor your infrastructure. Here’s a step-by-step guide on how to monitor IT infrastructure using open-source tools:
1. Define Your Monitoring Goals
- Determine what components you need to monitor:
- Servers (CPU, RAM, Disk, Network)
- Storage (SAN/NAS, IOPS, latency, capacity)
- Virtualization (Hypervisors, VMs)
- Kubernetes (Pods, Nodes, Deployments)
- Network (Switches, Routers, Bandwidth)
- Applications (Databases, Web servers)
- AI Workloads (GPU utilization, temperature)
- Identify key metrics (latency, uptime, throughput, etc.).
2. Choose the Right Open-Source Monitoring Tools
Here’s a list of commonly used open-source tools for monitoring different parts of your IT infrastructure:
General Monitoring
- Prometheus: Great for time-series monitoring, especially for Kubernetes, Linux, and application metrics.
- Zabbix: All-in-one monitoring for servers, networks, and applications.
- Nagios: Highly extensible tool for monitoring servers and networks.
- Netdata: Real-time monitoring for performance metrics.
- Glances: Cross-platform monitoring for Linux, Windows, and macOS.
- Telegraf: Collects metrics from systems and sends them to a time-series database.
Kubernetes Monitoring
- Kubernetes Dashboard: Native monitoring for Kubernetes clusters.
- Prometheus with Grafana: Widely used for Kubernetes metrics.
- Kube-State-Metrics: Provides detailed Kubernetes resource metrics.
Storage Monitoring
- Ceph Dashboard: For Ceph-based storage solutions.
- Munin: Useful for monitoring disk usage and I/O.
Network Monitoring
- Cacti: Network graphing tool for bandwidth monitoring.
- ntopng: Real-time network monitoring and traffic analysis.
- Icinga: Great for network device monitoring with SNMP.
AI and GPU Monitoring
- NVIDIA DCGM (Data Center GPU Manager): For monitoring NVIDIA GPUs.
- Prometheus with GPU Exporter: Collects GPU metrics like utilization and memory usage.
Log Monitoring
- ELK Stack (Elasticsearch, Logstash, Kibana): Centralized log monitoring and visualization.
- Graylog: Log management and analysis.
3. Install and Configure Monitoring Tools
- Prometheus Example:
- Install Prometheus on a Linux server.
- Configure the
prometheus.ymlfile to scrape metrics from your systems. - Use Node Exporter for Linux servers and cAdvisor for container metrics.
- Grafana (optional): Install Grafana to visualize Prometheus metrics.
- Zabbix Example:
- Install Zabbix Server and Web Interface.
- Deploy Zabbix agents on your servers to collect metrics.
- Configure templates for storage, servers, or network devices.
4. Set Up Alerts
- Use alerting tools to notify your team when metrics exceed thresholds:
- Prometheus Alertmanager: Sends alerts via email, Slack, PagerDuty, etc.
- Zabbix Alerts: Configurable for various notification channels.
- Nagios Alerts: Customizable alert notifications.
5. Visualize Data
- Grafana: Connect to Prometheus, Zabbix, or other data sources to create dashboards.
- Kibana: Use with Elasticsearch for log visualization.
- Netdata Dashboard: Real-time interactive visualizations.
6. Collect Logs
- Centralize and analyze logs using:
- ELK Stack: Ship logs using Filebeat, process them with Logstash, and analyze in Kibana.
- Graylog: Collect and search logs with customizable dashboards.
7. Monitor Kubernetes
- Deploy Prometheus Operator or Kube-Prometheus for Kubernetes.
- Use kubectl top to view resource usage for nodes and pods.
- Add Grafana for detailed Kubernetes dashboards.
8. Automate and Scale
- Use Ansible, Terraform, or Chef to automate the deployment and scaling of monitoring tools.
- For large environments, use distributed setups for tools like Prometheus (e.g., Thanos for scaling).
9. Test and Tune Your Setup
- Simulate failures (e.g., stopping a service or overloading a server) to ensure alerts are triggered.
- Regularly update tools and configurations to adapt to changes in your infrastructure.
10. Document and Train
- Document your monitoring setup and processes.
- Train your IT team to use the monitoring tools effectively.
If you will use Grafana for monitoring and alert I recommend Telegraf and InfluxDB to predict, respond, and adapt in real-time monitoring.
Another solution I tested and recommend is Zabbix, it is all in one packet, there are advantages and disadvantages with comparing Grafana, you can test and use what ever you like.

Ali YAZICI is a Senior IT Infrastructure Manager with 15+ years of enterprise experience. While a recognized expert in datacenter architecture, multi-cloud environments, storage, and advanced data protection and Commvault automation , his current focus is on next-generation datacenter technologies, including NVIDIA GPU architecture, high-performance server virtualization, and implementing AI-driven tools. He shares his practical, hands-on experience and combination of his personal field notes and “Expert-Driven AI.” he use AI tools as an assistant to structure drafts, which he then heavily edit, fact-check, and infuse with my own practical experience, original screenshots , and “in-the-trenches” insights that only a human expert can provide.
If you found this content valuable, [support this ad-free work with a coffee]. Connect with him on [LinkedIn].


